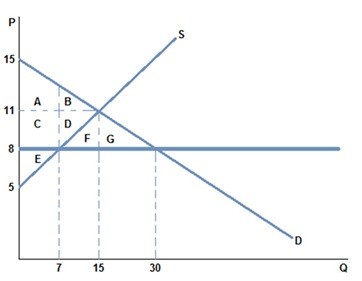
 The graph shown best represents:
A. a binding price floor.
B. a missing market.
C. a binding price ceiling.
D. a market for an inferior good.
Answer: C
You might also like to view...
Which of the following equations illustrates the equilibrium level of income with respect to the simple Keynesian closed-economy model?
a. Y = [1/(1 ? b)](a ? bT ? I + G) b. Y = [1/(1 ? b)](a + bT + I + G) c. Y = [1/(1 + b)](a ? bT ? I ? G) d. Y = [1/(1 ? b)](a ? bT + I + G) e. Y = (1 ? b)(a + bT + I + G)
Assume perfect capital mobility. Under a fixed exchange rate system, expansionary fiscal policy causes the value of the dollar to _____, while expansionary monetary policy causes the value of the dollar to _____
a. rise; rise b. fall; fall c. fall; rise d. rise; fall
The forecast is
A) made for some date beyond the data set used to estimate the regression. B) another word for the OLS predicted value. C) equal to the residual plus the OLS predicted value. D) close to 1.96 times the standard deviation of Y during the sample.
If for some reason Americans desired to decrease their purchases of foreign assets, then other things the same
a. both the real exchange rate and the quantity of dollars exchanged in the market for foreign-currency exchange would fall. b. both the real exchange rate and the quantity of dollars exchanged in the market for foreign-currency would rise. c. the real exchange rate would rise and the quantity of dollars exchanged in the market for foreign-currency would fall. d. the real exchange rate would fall and the quantity of dollars exchanged in the market for foreign-currency would rise.