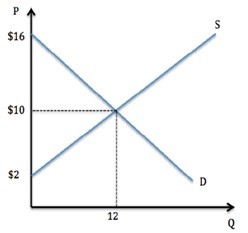
 According to the graph shown, producer surplus is:
A. $120.
B. $48.
C. $36.
D. None of these.
Answer: B
You might also like to view...
Human capital refers to the
A. number of workers available in the economy. B. tools and equipment available to workers. C. education, training, and skills of workers. D. amount of financing available to start-up firms.
Refer to Figure 5-9. An efficient way to get the firm to produce the socially optimal output level is
A) to grant a subsidy to enable the industry to internalize the external costs of production. B) to assign property rights to the firms in the industry. C) to impose a tax to make the industry bear the external costs it creates. D) for government to set a quota on the quantity of toilet paper that the toilet paper industry can produce.
A change in the slope of an isocost line is due to a change in
A) the price of one or both inputs. B) quantity of output. C) total cost. D) the output price.
Suppose current government spending decreases and that individuals expect future government spending to decrease. Given this information, in which of the following cases will output in the current period be more likely to decrease?
A) Individuals consider only the short run effects of changes in future macro variables when forming expectations of future output and future interest rates. B) Individuals consider only the medium run effects of changes in future macro variables when forming expectations of future output and future interest rates. C) Individuals consider only the long run effects of changes in future macro variables when forming expectations of future output and future interest rates. D) The output effects will be the same in B and C.