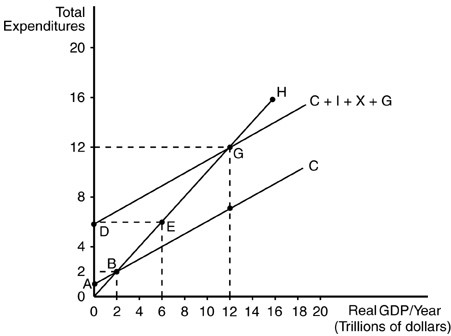
 Refer to the above figure. The equilibrium level of real Gross Domestic Product (GDP) is
A. $7 trillion.
B. $12 trillion.
C. $6 trillion.
D. $20 trillion.
Answer: B
You might also like to view...
Which of the following statements is true?
A) The growth rate of manufactured exports from the U.S. exceeded the growth rate of manufactured goods from China in the early 2000s. B) The U.S. economy has failed to meet the demand for manufactured goods domestically. C) U.S. exports are worth more than its imports. D) The import of crude oil by the U.S. has been declining since 1960.
Ten individuals have $100 and identical preferences for picnics, p, and kayak trips, k, where U(p, k) = k0.5p0.5. The price of picnics is $5 and the price per kayak trip is $ 10
What is the shortage/surplus in the market when the supply of picnics totals 120? A) There is a surplus of 20. B) There is a shortage of 20. C) The market is in equilibrium. Therefore, there is no surplus/shortage. D) There is not enough information to answer this question.
The gold standard dominated exchange rate systems during what period?
A) from 1776 to 1816 B) from 1836 to 1849 C) from 1870 to 1913 D) from 1945 to 1965
Suppose that growth in output that can be attributed to growth in labor and capital is 6%. If output grows at a rate of 6%, it must be the case that
A. growth in capital exceeds growth in labor. B. the economy is not experiencing technological progress. C. the economy is experiencing technological progress. D. growth in labor force exceeds growth in capital.