Figure 11-2
?
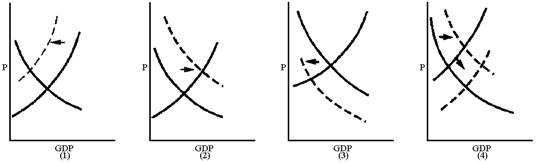
Which graph in Figure 11-2 best reflects a supply-sider’s view of the impact of an increase in the personal income tax rate?
A. 1
B. 2
C. 3
D. 4
Answer: A
You might also like to view...
Real consumption is a function of real disposable income, but the simple Keynesian model uses real GDP instead of real disposable income. This is appropriate since
A) we cannot measure either exactly and the purpose of the exercise is theoretical only. B) real disposable income tends to move proportionately with real GDP. C) real disposable income is a fixed percentage of real GDP. D) real GDP is a fixed percentage of real disposable income.
In which of the following situations will the equilibrium price of wheat increase and the change in the equilibrium quantity of wheat be indeterminate?
a. if supply and demand both decline b. if supply and demand both rise c. if supply declines and demand rises d. if supply rises and demand declines e. if supply remains constant and demand rises
During the 2007-2009 financial crisis, the Federal Reserve took some unusual steps in its conduct of monetary policy. Which of the following was not one of them? a. It invested in AIG
b. It invested more than $1 trillion in mortgage-backed securities. c. It worked with the U.S. Treasury and with other regulators to stabilize banks and thaw frozen credit lines. d. It worked with the U.S. Treasury and other regulators to help conduct a stress test of the 19 largest banks. e. It bailed out General Motors.
What is the typical relationship among interest rates on three-month Treasury bills, long-term Treasury bonds, and Baa corporate bonds?
What will be an ideal response?