Exhibit 2-14 Production possibilities curve
In Exhibit 2-14, which of the following explains this economy's movement from point E to point F?
A. The rate of unemployment in this economy would have increased.
B. Consumption goods production has increased, but capital goods production has decreased.
C. The economy has decreased unemployment, but some degree of unemployment still exists
D. The economy has achieved full employment.
Answer: D
You might also like to view...
Everything else held constant, when the current value of the domestic exchange rate increases, the ________ of domestic assets ________
A) quantity supplied; does not change B) supply; decreases C) quantity supplied; increases D) supply; increases
Equilibrium price is _____ and equilibrium quantity is _____ units.
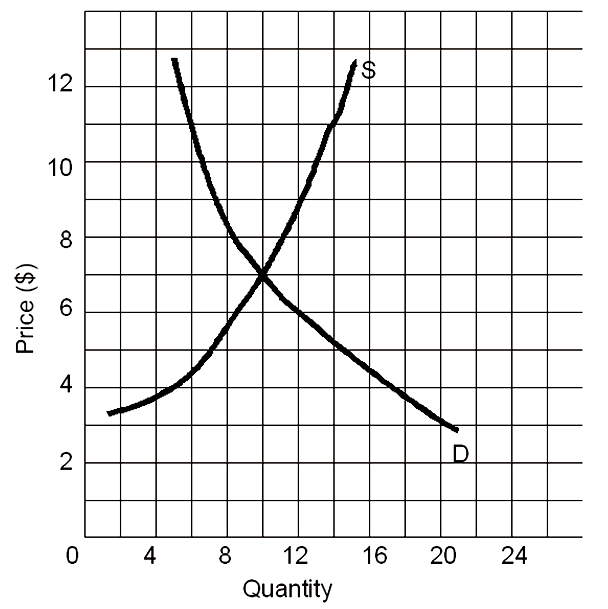
A. $8; 9
B. $7; 10
C. $6; 10
D. $5; 9
Reflecting the theories of Smith, Ricardo, and Heckscher-Ohlin, free trade permits ______, which allows a country to manufacture and export in those areas where they have a comparative advantage
Fill in the blank(s) with the appropriate word(s).
Both tariffs and quotas lead to a decrease in imports, a decrease in domestic consumption, and an increase in domestic production
Indicate whether the statement is true or false