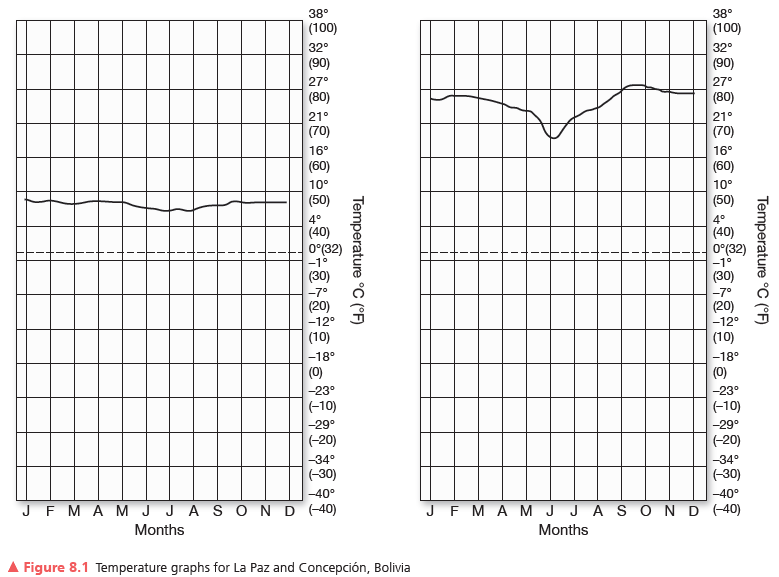
Using the temperature graphs provided in Figure 8.1, plot the data from Table 8.1 for these two cities. Use a smooth curved line graph to portray the temperature data. Calculate the average annual temperature and the temperature range (difference between the highest and lowest) for each city.
What will be an ideal response?
Environmental & Atmospheric Sciences
You might also like to view...
Since levees can protect many areas during floods, why are they controversial? What will be an ideal response?
Environmental & Atmospheric Sciences
By the end of the Permian, the Absaroka Sea had retreated from the craton, exposing what type of deposits?
A)evaporite B)black shale C)volcanic D)red bed E)reef
Environmental & Atmospheric Sciences
Which of the following solutions can function as a buffer?
A) a solution containing HCl and NaCl B) a solution containing NaOH and NaCl C) a solution containing HC2H3O2 and NaC2H3O2 D) all of the above
Environmental & Atmospheric Sciences
Salt wedging is of slight consequence in ________
A) regions above the treeline B) humid regions C) marshes D) arid regions E) volcanic regions
Environmental & Atmospheric Sciences