Refer to the diagram. Curve B is a:
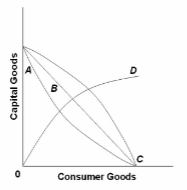
A. production possibilities curve indicating constant opportunity costs.
B. production possibilities curve indicating increasing opportunity costs.
C. demand curve indicating that the quantity of consumer goods demanded increases as the price of capital falls.
D. technology frontier curve.
A. production possibilities curve indicating constant opportunity costs.
You might also like to view...
Since 1981, the
A) real wage rate increased steadily. B) nominal wage rate increased and the real wage rate did not change by very much. C) real wage rate increased more than the nominal wage rate. D) nominal wage rate increased at an uneven pace whereas the increase in the real wage rate was steady and constant. E) nominal wage rate and real wage rate both decreased.
Students can change the direction of the greater society through volunteering and other forms of involvement. They are also subject to the greater economy and environment. In the 1990s, college students, for the most part:
a. Enjoyed a strong economy with multiple job choices and a technology explosion. b. Flooded into social work and helping others professions c. Questioned authority and dealt with years of unrest and change d. Conformed and were very conservative, held traditional values
To understand how poverty, inequality, and discrimination affect the economy, __________ analysis is used, and _________ analysis is used to address whether the government should try to reduce inequality in the name of social justice.
A. positive; objective B. subjective; normative C. normative; positive D. positive; normative
The money supply and velocity of money tell us the:
A. nominal value with inflation accounted for. B. real output. C. price value of real output. D. nominal value of firm output.