Use the line graph to answer the question.The line graph shows the 2001 sales data for the Big "D" company. 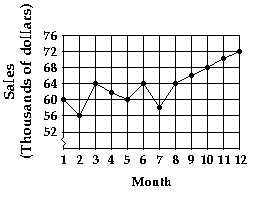 Find the increase in sales between month 8 to month 11.
A. $2000
B. $8000
C. $4000
D. $6000
Answer: D
You might also like to view...
Solve the problem.Imagine a large tank with cross-sectional area A. The bottom of the tank has a circular drain with cross-sectional area a. Assume the tank is initially filled with water to a height h(0) = H. The height of the water as it flows out of the tank is described by the equation  where
where 
 and
and  is the acceleration due to
gravity. Find the water height function for 

 Then determine the approximate time at which the tank is first empty. If necessary, round to two decimal places.
A. h(t) = (1.4 - 0.2t )2; 2.24
B. h(t) = (1.4 - 0.2t )2; 1.58
C. h(t) = (1.4 - 0.1t )2; 4.47
D. h(t) = (1.4 - 0.1t )2; 3.16
On a globe, locate Tokyo, Seattle, and Honolulu. Connect these cities with the shortest paths to form a triangle. Next, use a protractor to measure the angles. What is their sum?Answer 180 degrees, less than 180 degrees, or greater than 180 degrees.
What will be an ideal response?
Use the Factor Theorem to determine whether the linear polynomial is a factor of the second polynomial.x - 7; 3x3 - 22x2 - 3x + 70
A. Yes B. No
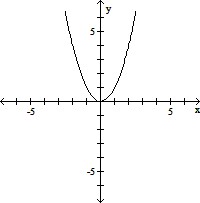
Graph the function by starting with the graph of the basic function and then using the techniques of shifting, compressing, stretching, and/or reflecting.f(x) = (-x)2 
A. 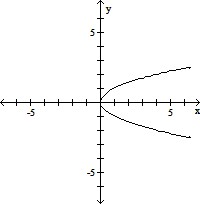
B. 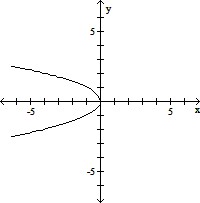
C. 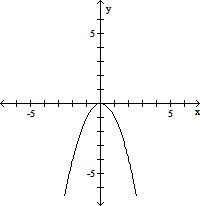
D.