The bar graph shows the number of students who flunk Dr. Jones' class each year. 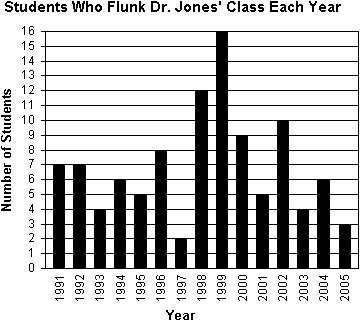 During which year(s) did Dr. Jones' have more than 9 students flunk his class?
A. 1998, 1999, 2000, 2002
B. 1998, 1999
C. 1998, 1999, 2002
D. 1998, 1999, 2000
Answer: C
Mathematics
You might also like to view...
Find the volume of the solid generated by revolving the shaded region about the given axis.About the x-axis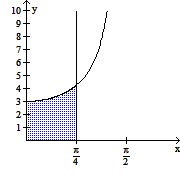
A. 3?
B.  ?
?
C.  ?
?
D. 9?
Mathematics
Solve the differential equation subject to the initial conditions.x  + 5y = x2; y = 12 when x = 2
A. y =  +
+ 
B. y =  -
- 
C. y =  + 7x5
+ 7x5
D. y =  +
+ 
Mathematics
Find the location of the indicated absolute extremum for the function.Maximum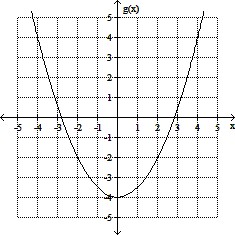
A. x = -4
B. x = 
C. No maximum
D. x = 0
Mathematics
Find the exact value of the expression.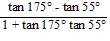
A. - 
B. -2
C. - 
D. -
Mathematics