Refer to the graph shown.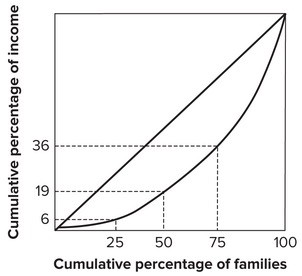 The poorest 50 percent of the families earn:
A. 19 percent of the income.
B. 64 percent of the income.
C. 6 percent of the income.
D. 36 percent of the income.
Answer: A
You might also like to view...
In Figure 10-5 above, suppose that the level of government expenditures increases. This causes a movement of the steady-state point such as from points
A) A to B. B) D to B. C) D to C. D) A to C. E) A to D.
An inelastic supply schedule means that suppliers are unable to substitute away from producing a good in response to a tax
a. True b. False
A government program that invested in financial institutions and automakers to help stabilize markets during the great recession of 2008 was the _____
a. Troubled Asset Relief Program b. Social Security System c. Supplemental Security Income Program d. Public Housing Assistance Program e. Deposit Insurance Program
In the circular-flow diagram, one loop represents the flow of goods, services, and factors of production, and the other loop represents the corresponding flow of dollars
a. True b. False Indicate whether the statement is true or false