Refer to the information provided in Figure 29.1 below to answer the question(s) that follow.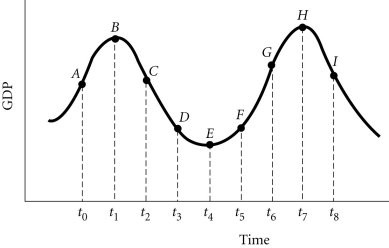 Figure 29.1Refer to Figure 29.1. Suppose it takes policy makers from time t2 to time t4 to take an action to stimulate the economy. This is an example of
A. implementation lag.
B. cyclical lag.
C. response lag.
D. recognition lag.
Answer: A
You might also like to view...
In the figure above, when the price of a disk is $B, total revenue is shown in the graph by area
A) BCF0. B) AGF0. C) FCDE. D) ADE0.
Assume a company can offer customers cable television and Internet service at essentially zero marginal and average cost
The following table shows each customer's marginal willingness to pay for television, Internet services, and for a bundle containing both. If television and Internet services are sold separately, the profit maximizing prices are Television Internet Bundle Alex $100 $60 $160 Rebecca $80 $100 $180 A) television $100 and Internet services $60. B) television $80 and Internet services $100. C) television $80 and Internet services $60. D) television $100 and Internet services $100.
The budget constraint shown below is consistent with a pricing strategy that involves a 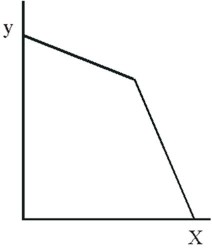
A. price increase of X for large quantities. B. price reduction of X for large quantities purchased. C. constant price of X for all quantities purchased. D. price change of X and a nominal income increase for the consumer.
Most economists consider the GDP deflator as ________ of inflationary pressures in the economy.
A. the least accurate measure B. the best overall indicator C. only valid as a wholesale price measure D. an overvalued measure