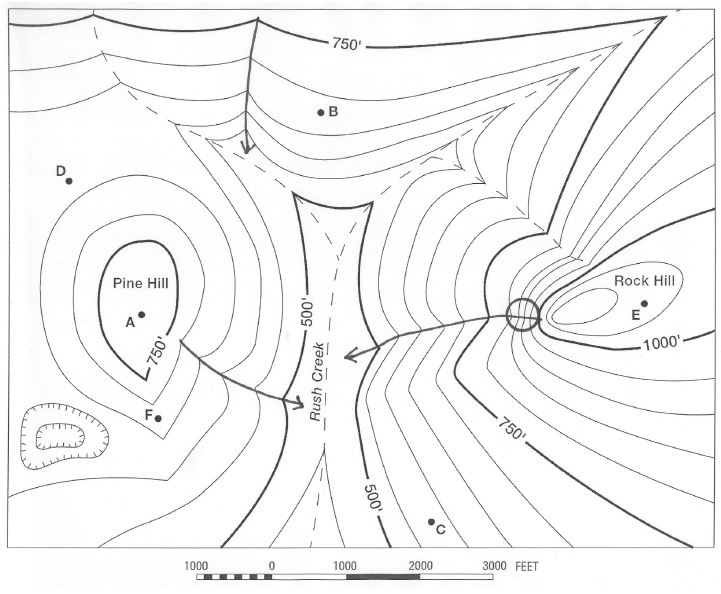
Where is the lowest elevation shown in this landscape? (It may not be a location marked with a letter.)
The question is based on this contour line map with elevations shown in feet.
• North is to the top of the map.
• Streams are shown with dashed lines.
• A graphic scale for measuring horizontal distances is shown below the map.
• Estimate elevations between contour lines to the nearest half-contour interval; assume that the top of a
hill is one-half-contour interval higher than the highest contour line shown.

What will be an ideal response?
Where Rush Creek leaves the map
You might also like to view...
A floating leaf oscillates up and down two complete cycles each second as a water wave passes by. What is the wave's frequency?
A) 0.5 Hz B) 1 Hz C) 2 Hz D) 3 Hz E) 6 Hz
During the Mesozoic, North America was moving ____
a. westward b. southeast c. northeast d. southwest e. not at all
Which of the following is not a factor in determining the amount of water vapor at one specific point in the atmosphere?
A) local evaporation B) horizontal transport of moisture C) aerosol concentration D) vertical transport of moisture
____________________ are the primary cause of ozone-layer depletion
Fill in the blank(s) with correct word