The above figure shows the domestic market for wheat. Suppose this market is isolated from global competition and the government intervenes by setting a support price of $15 a ton
The quantity bought by domestic users once the price support is in place is A) 300 million tons.
B) 400 million tons.
C) 250 million tons.
D) 200 million tons.
E) 100 million tons.
E
You might also like to view...
The fact that articles of clothing sold in Walmart are produced by very poorly paid workers in Honduras, is a fact that if taken into account
A) would prove to economists that the Ricardian model of comparative advantage is false. B) would prove to economists that the equal-value in trade concept summed up in the trade triangles is incorrect. C) proves to economists that trade is a negative sum game. D) proves to the Anti-Globalization Movement that trade is a negative sum game. E) proves that corporations are exempt from labor standards.
Altruism describes:
A. a motive for action in which a person's utility is unaffected when another's utility increases. B. a motive for action in which a person's utility is decreased when another's utility increases. C. a motive for action in which a person's utility is increased when another's utility increases. D. a motive for action in which a person's utility becomes negative when another's utility increases.
Office workers and word processing programs are complements if:
A. a decrease in the wage paid to office workers leads to an increase in the demand for word processing programs. B. a decrease in the wage paid to office workers leads to a leftward shift in the demand for word processing programs. C. they perform similar functions. D. an increase in the price of word processing programs leads to an increase in the demand for office workers.
Refer to the information provided in Figure 9.7 below to answer the question(s) that follow. 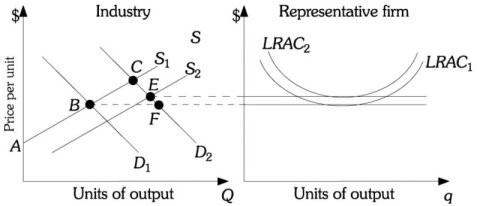 Figure 9.7 Refer to Figure 9.7. This increasing cost industry's ________ would be found by drawing a line from points B to E.
A. long-run demand curve B. marginal revenue curve C. marginal cost curve D. long-run supply curve