Refer to the following graph. An increase in supply is reflected as
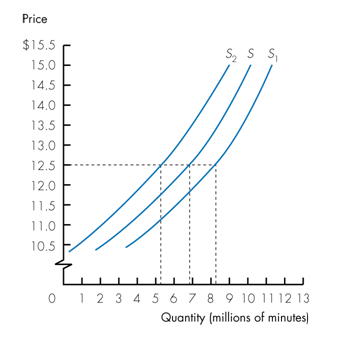
a. a shift of the supply curve from S to S2.
b. a shift of the supply curve from S to S1.
c. a shift of the supply curve from S1 to S2.
b. a change in the quantity supplied from 6.8 to 5.2 million minutes when price is $12.50.
b. a shift of the supply curve from S to S1.
You might also like to view...
Refer to the table above. If the world price of trousers is $8 per pair, then which of the following statements is true?
A) Country B, Country C, and Country D will export trousers, whereas Country A will import trousers. B) Country A, Country C, and Country D will import trousers, whereas Country B will export trousers. C) Only Country B will import trousers, whereas Country A, Country C, and Country D will export trousers. D) All countries will import trousers.
What are some of the differences between the population policies of China and India? What factors may have contributed to their success or failure?
What will be an ideal response?
The slowing of the American economy in 2008–2009 gave businesses a strong incentive to raise capital investment.
Answer the following statement true (T) or false (F)
Suppose there is a tornado that levels a city. As rebuilding begins, how might you analyze this effect in the market for lumber?
A. The demand for lumber would increase, increasing both the equilibrium price and quantity. B. The demand for lumber would increase, decreasing the equilibrium price and increasing the equilibrium quantity. C. The supply of lumber would decrease, increasing the equilibrium price and decreasing the equilibrium quantity. D. The supply of lumber would increase, decreasing the equilibrium price and increasing the equilibrium quantity.