Solve the problem.The results of a school election for student president are shown in the following table.  What is the probability that a randomly polled voter voted for Candidate C?
A. 0.5
B. 0.6
C. 0.21
D. 0.3
Answer: C
You might also like to view...
Use the given transformation to evaluate the integral. src="https://sciemce.com/media/4/ppg__ghvb0609192137__f1q32g7.jpg" alt="" style="vertical-align: -4.0px;" />

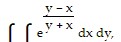 Rwhere R is the trapezoid with vertices at


A. 
B. 
C. 
D. 
The graph of a function f is given. Use the graph to answer the question.What are the x-intercepts?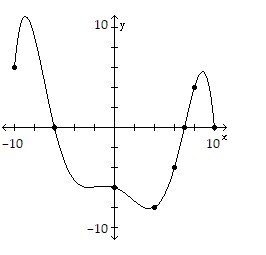
A. (-10, 0), (-6, 0), (7, 0), (10, 0) B. (-6, 0), (7, 0) C. (-6, 0) D. (-6, 0), (7, 0), (10, 0)
Graph y = f (x). Be sure to include any vertical asymptote as a dashed line.f(x) = 
A. 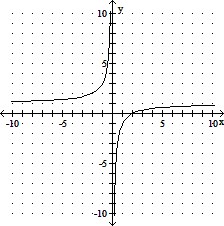
B. 
C. 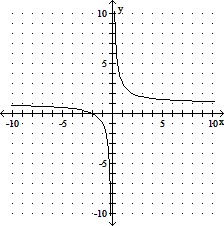
D. 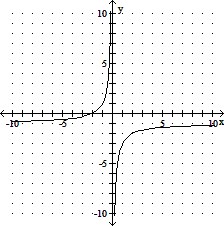
Each of the two diagrams in the figure below shows lines in the same plane. Determine whether the following statement is true or false.
?
The lines c?2 and ?d?2 are horizontal.
?
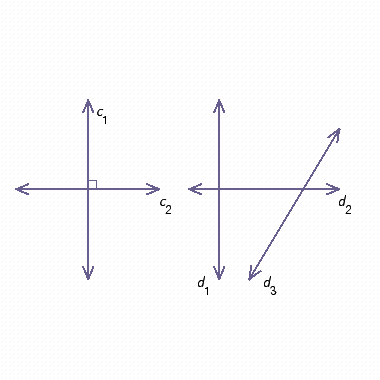
What will be an ideal response?