Solve the problem.Suppose that the speed of a car, measured in miles per hour (mph), is monitored for some short period of time after the driver applies the brakes. The following table relates the speed of the car to the amount of time, measured in seconds (sec), elapsed from the moment that the brakes are applied. Make a scatter diagram of the data. What is happening to the speed of the car during this time frame?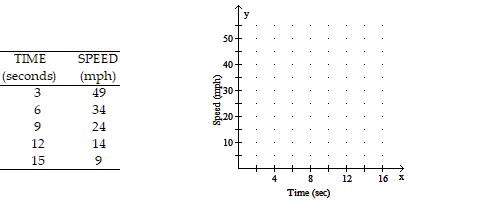
A. The speed of the car
decreased as time elapsed.
B. The speed of the car
decreased as time elapsed.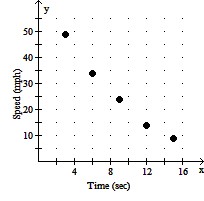
C. The speed of the car
increased as time elapsed.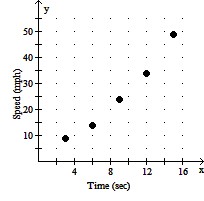
D. The speed of the car
increased as time elapsed.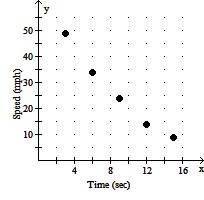
Answer: B
Mathematics
You might also like to view...
Find the derivative.y = (csc x + cot x)(csc x - cot x)
A. y ' = - csc x cot x B. y ' = 0 C. y ' = 1 D. y ' = - csc2 x
Mathematics
Provide an appropriate response.For the equation 5x + y = 7, write the solution in ordered pair form if y = 2.
A. (2, 1) B. (2, -3) C. (1, 2) D. (-3, 2)
Mathematics
Simplify the expression.
A. 
B. - 
C. - 
D. 
Mathematics
Graph the function.f(x) = 

A. 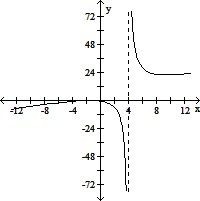
B. 
C. 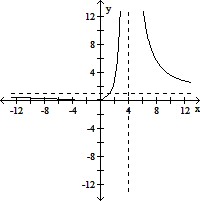
D. 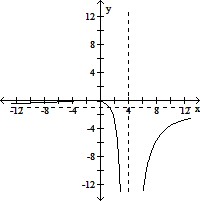
Mathematics