Sketch the requested graphs.Begin by graphing the standard absolute value function f(x) =  as a solid curve. Then use transformations of this graph to graph the function g(x) =
  + 2 as a dashed curve.
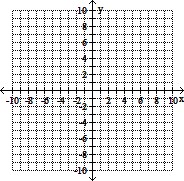
A. 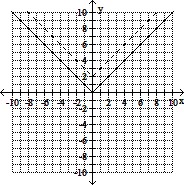
B. 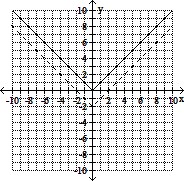
C. 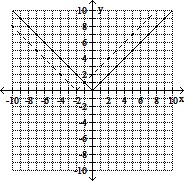
D. 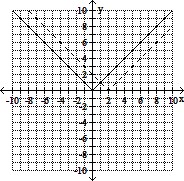
Answer: A
Mathematics
You might also like to view...
Solve the equation.77x = 343
A. x = 343
B. x = 2,187
C. x = 
D. x = 
Mathematics
Solve the problem.Find the sum of the infinite series 1 + 2r + 5r2 + 2r3 + r4 + 2r5 + 5r6 + 2a7 + r8 ... for those values of r for which it converges.
A. 
B. 
C. 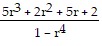
D. 
Mathematics
Find the domain of the logarithmic function.f(x) = ln(-7 - x)
A. (-?, -7) B. (-?, 7) C. (-7, ?) D. (7, ?)
Mathematics
Graph the function f(x) over the given interval. Partition the interval into 4 subintervals of equal length. Then add to your sketch the rectangles associated with the Riemann sum  , using the indicated point in the kth subinterval for ck.f(x) = -4x2, [0, 4], left-hand endpoint
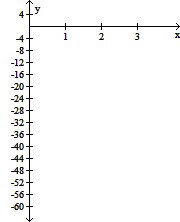
A. 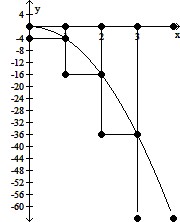
B. 
C. 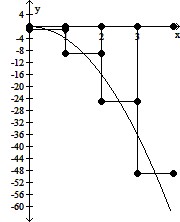
D. 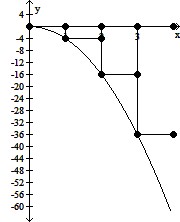
Mathematics