Explain the impact, if any, of each of the following on the production possibilities curve:
a. Europe's population fell by 30 to 60 percent following an outbreak of bubonic plague, also known as Black Death, in the fourteenth century.
b. In the next 20 years, a sizeable proportion of the United States labor force is expected to include many people who are above the age of 65 .
c. Canada recently discovered large reserves of shale gas (shale gas is natural gas that is trapped in fine-grained sedimentary rock).
a, A fall in the population would reduce the availability of labor in the economy. With a fall in the number of workers, the production possibilities curve will shift inward.
b. An increase in the number of people who are older than 65 years would mean that there are fewer people in the economy who are available and willing to work. This would imply an inward shift of the production possibilities curve.
c. With the discovery of shale gas reserves, Canada's stock of natural resources increases. The production possibilities curve will shift outwards.
You might also like to view...
Answer the following statements true (T) or false (F)
1) Uncertainty is the result of incomplete information. 2) Probability is the chance that an event occurs. 3) It is possible for the probability of an event to be 1.50. 4) A probability distribution of a random variable is a listing of all of the possible outcomes of the random variable and the associated probabilities. 5) The larger the extent of variation, the smaller the risk.
A buyer is said to have a demand for a good only when
A. An adequate supply of the good is available for purchase. B. The buyer is both willing and able to purchase the good. C. The buyer has the income but the good is not preferred. D. The buyer is not willing to buy the good and does not have enough income to purchase the good.
According to monetarists, which of the following would be most important for the control of inflation?
A. a steady increase in federal expenditures B. the imposition of price controls C. keeping the growth rate of the money supply low and steady D. a steady increase in the size of the budget deficit
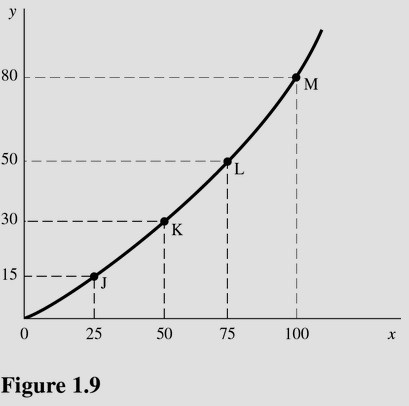 In Figure 1.9, the slope of the line between points L and M is
A. 0.67. B. 0.75. C. 1.20. D. 0.80.