The following table gives the index of prices farmers paid in three different years. The price farmers received in year 1, the base year, for a certain agricultural product was $4.00 per bushel. Compute the parity price of the product in years 2 and 3
and enter them in the table. Compute the parity ratio and enter it into the table.
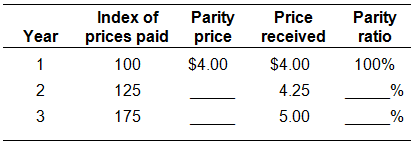
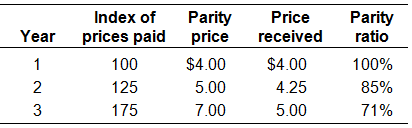
The parity price is figured by multiplying $4.00 times the price index (expressed in hundredths) for a year. Year 2 ($4.00 ? 1.25 = $5.00). Year 3 ($4.00 ? 1.75 = $7.00). The parity ratio is the ratio of prices received to prices paid and multiplied by 100 to obtain a percentage for Year 2 [($4.25/$5.00) ? 100 = 85%]. For Year 3 [($5.00/$7.00) ? 100 = 71%].
You might also like to view...
Netflix is the largest online DVD rental service offering flat rate online streaming to customers in the United States. Currently, there are approximately 8 million subscribers
Suppose Netflix decreases its flat rate rental by 10 percent and an additional 1 million people subscribe. This information means that Netflix's demand is A) elastic. B) inelastic. C) unit elastic. D) perfectly elastic.
Suppose there is a new technological invention that will allow you to put any resource into a special black box and in an instant anything that you program it to produce will be produced? Does this invention end scarcity? Why or why not?
What will be an ideal response?
When it comes to macro-policy, most economists now agree that
a. policy should be constantly changing in response to business cycle conditions. b. policy changes should exert stimulus during inflationary booms and restraint during downturns. c. given our ability to forecast economic conditions, policy changes easily can be implemented in a timely manner. d. policy changes are difficult to time correctly, and therefore constant shifts in policy are likely to be a source of economic instability.
The competitive firm's short-run supply curve is that portion of the
a. average variable cost curve that lies above marginal cost. b. average total cost curve that lies above marginal cost. c. marginal cost curve that lies above average variable cost. d. marginal cost curve that lies above average total cost.