Trade sanctions imposed on Iraq that limited Iraq's production of oil after the 1990 Gulf War on the oil market are best shown graphically with a price ceiling below equilibrium price.
Answer the following statement true (T) or false (F)
False
Trade sanctions imposed on Iraq after the 1990 Gulf War on the oil market is best shown graphically with a shift to the left in the world supply of oil. Equilibrium price of oil rose as a consequence.
You might also like to view...
Use the following graph to answer the next question.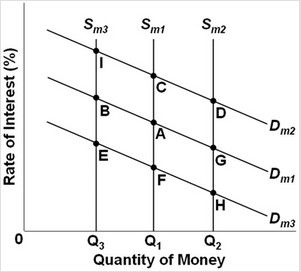 The graph shows the supply and demand for money where Dm1, Dm2, and Dm3 represent different demands for money and Sm1, Sm2, and Sm3 represent different levels of the money supply. The initial equilibrium point is A. What will be the new equilibrium point following a decrease in the transactions demand for money?
A. I B. B C. E D. F
Which of the following would shift the demand curve for gasoline to the right?
a. a decrease in the price of gasoline b. an increase in consumer income, assuming gasoline is a normal good c. an increase in the price of cars, a complement for gasoline d. a decrease in the expected future price of gasoline
David Ricardo used the example of land to demonstrate the concept of rent, as the supply of land is
A. relatively elastic. B. perfectly elastic. C. negatively sloped. D. perfectly inelastic.
1 - APC = _________________.
Fill in the blank(s) with the appropriate word(s).