Of the collection of supply and demand diagrams in Figure 2.2, which one shows the result of an increase in the price of an input in the market for anything?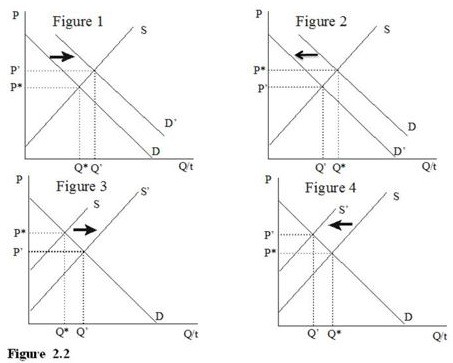
A. Figure 1
B. Figure 2
C. Figure 3
D. Figure 4
Answer: D
You might also like to view...
The table above shows Randy's Shirts' short-run production function. Randy hires workers at a wage rate of $50 a day and his total fixed cost is $100
a) What is the marginal product of the 3rd worker? b) What is Randy's average fixed cost if 48 shirts are produced? c) What is Randy's average variable cost if 56 shirts are produced? d) What is Randy's marginal cost of producing the 52nd sweater? e) What is Randy's average total cost if 48 sweaters are produced?
A law requiring the government to balance its budget in each year would serve as an automatic destabilizer
Indicate whether the statement is true or false
Refer to the table below. Busy Betty sells her cakes for $20 each and her constant marginal cost to produce each cake is $12, which is equal to her (constant) average total cost. If she does not sell a cake the day she makes it, she sells it as day-old cake for $10. What is her expected marginal cost of holding the 23rd cake in inventory?
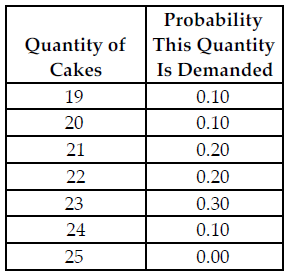
The above table shows the probability distribution of cake sales at Busy Betty's Bakery.
A) $6.60
B) $0.40
C) $1.20
D) $2.00
Goods that are neither rival in consumption nor excludable are:
A. a public good. B. an artificially scarce good. C. a common resource. D. a private good.