The following comparison line graph indicates the number of vehicles sold for a seven week period by two different salespeople. Use the graph to answer the question.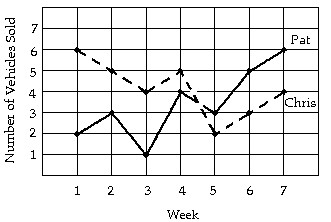 During what week did Pat sell the fewest number of vehicles?
A. Week 7
B. Week 1
C. Week 3
D. Week 5
Answer: C
Mathematics
You might also like to view...
Find the focus and directrix of the parabola.-  x2 = y
A. (0, -10); y = 10 B. (-20, 0); x = 10 C. (0, 10); y = -10 D. (0, -10); y = -10
Mathematics
Find the sum of the geometric series for those x for which the series converges.
A. 
B. 
C. 
D. 
Mathematics
Perform the operation and simplify, or solve the equation for the variable. +
+ 
A. 
B. 
C. 
D. 
Mathematics
List the factors of the number.28
A. 1, 2, 4, 7, 14, 28 B. 1, 2, 7, 14, 28 C. 1, 2, 4, 7, 8, 14, 28 D. 2, 7, 14, 28
Mathematics