Solve the problem.The following data represents the height (in inches) and weight (in pounds) of 9 randomly selected adults.  Graph the data on a scattergram treating height as the independent variable. Find an equation of the line containing the points (62, 126) and (70, 181). Graph the line on the scattergram. Interpret the slope of the line. Use the line to predict the weight of a person who is 72.2 inches tall. Round to the nearest pound.
What will be an ideal response?
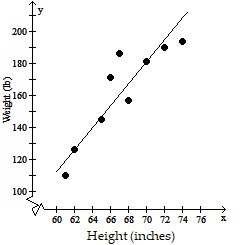
y = 6.875x - 300.25
If height is increased by one inch, then weight will increase by 6.875 pounds
196 lb
Mathematics
You might also like to view...
Solve the quadratic inequality. Write your answer in interval notation.x2 - 3x - 10 < 0
A. (5, ?) B. (-?, -5) C. (-?, -2) D. (-2, 5)
Mathematics
Find  for the function
  . Simplify your answer.
?
. Simplify your answer.
?
A. 
B. 
C. 
D. 
E. 
Mathematics
Write the interval as an inequality involving x. Graph the inequality.(5, ?)![]()
A. x < 5![]()
B. x ? 5![]()
C. x > 5![]()
D. x ? 5![]()
Mathematics
Convert the given interest rate to decimal form if it is given as a percentage, and to a percentage if it is given in decimal form.0.25 to percent
A. 25% B. 2.25% C. 2.5% D. 0.0025%
Mathematics