Exhibit 8-13 Price and cost per unit curves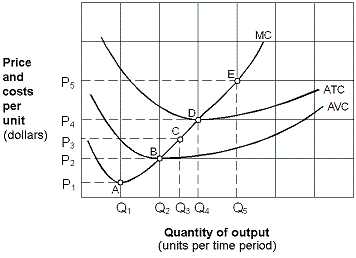
In Exhibit 8-13, if the price is P3, total economic profit is maximized or economic loss minimized at the output:
A. Q1.
B. Q2.
C. Q3.
D. Q4.
Answer: C
You might also like to view...
Electric utility companies have built larger and larger electric generating stations and, as a result, the long-run average cost of producing each kilowatt hour decreased. This is an example of
A) increasing marginal returns. B) diminishing marginal returns. C) economies of scale. D) diseconomies of scale.
Emma uses a linear model to forecast quarterly same-store sales at the local Garden Center. The results of her multiple regression is: Sales = 2,800 + 200•T - 350•D where T goes from 1 to 16 for each quarter of the year from the first quarter of 2006 (‘06I) through the fourth quarter of 2009 (‘09 IV). D is a dummy variable which is 1 if sales are in the cold and dreary first quarter, and
zero otherwise, because the months of January, February, and March generate few sales at the Garden Center. Use this model to estimate sales in a store for the first quarter of 2010 in the 17th month; that is: {2010 I}. Emma's forecast should be: a. 5,950 b. 6,200 c. 6,350 d. 6,000 e. 5,850
A signal is
a. a proxy measure of job conditions b. a proxy measure of a job applicant's skills c. used by employers to indicate that a job interview is over d. an indication of an excess supply of labor e. an indication of an excess supply of qualified labor
The narrow definition of the money supply includes only currency held by the nonbanking public
a. True b. False Indicate whether the statement is true or false