Using Figure 1 above, if the aggregate demand curve shifts from AD3 to AD2 the result in the long run would be: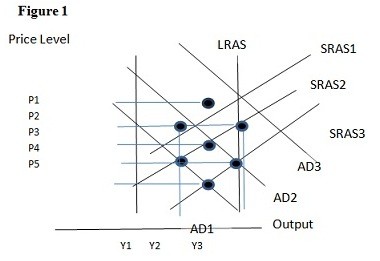
A. P1 and Y2.
B. P2 and Y1.
C. P3 and Y1.
D. P3 and Y2.
Answer: D
You might also like to view...
Each of the four firms in an industry has a market share of 25 percent. The Herfindahl-Hirschman Index equals
A) 3,600. B) 100. C) 625. D) 25. E) 2,500.
Bobby moves along an indifference curve for shirts and pants by increasing consumption of shirts and decreasing consumption of pants. As Bobby has more and more pants, the number of shirts he is willing to trade for yet another pair of pants
A) decreases. B) increases. C) does not change. D) initially decreases and then increases.
The monopoly's marginal revenue curve
a. is equivalent to its demand curve b. lies below its demand curve c. is perfectly elastic d. is perfectly inelastic e. has a positive slope
An increase in the marginal propensity to save from .3 to .4 will cause
A) the ZZ line to become steeper and a given change in autonomous consumption (c0 ) to have a smaller effect on output. B) the ZZ line to become steeper and a given change in autonomous consumption (c0 ) to have a larger effect on output. C) the ZZ line to become flatter and a given change in autonomous consumption (c0 )) to have a smaller effect on output. D) the ZZ line to become flatter and a given change in autonomous consumption (c0 ) to have a larger effect on output.