Based on the graph showing the effects of a government budget surplus, a budget surplus would lead to ______.
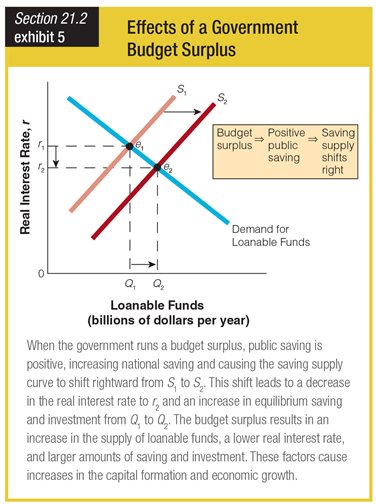
a. a shift in the demand curve for loanable funds to the right
b. a shift in the supply curve for loanable funds to the left
c. a decrease in loanable funds from Q2 to Q1
d. an increase in loanable funds from Q1 to Q2
d. an increase in loanable funds from Q1 to Q2
You might also like to view...
The U.S. dollar exchange rate, e, expressed as Japanese yen per U.S. dollar, will depreciate when:
A. the U.S. Federal Reserve tightens monetary policy. B. real GDP in Japan increases. C. real GDP in Japan decreases. D. U.S. consumers decrease their preference for Japanese cars.
Which of the following are devices that the government uses to achieve a more efficient allocation of resources in the presence of external benefits?
A) taxes, private subsidies, and regulation B) public provision, taxes, and private subsidies C) regulations, public provision, and vouchers D) vouchers, public provision, and private subsidies E) public provision, taxes, and vouchers
If a marginal cost pricing rule is imposed on the natural monopoly shown in the figure above, then it will produce
A) 2 million units. B) 3 million units. C) 4 million units. D) 5 million units.
Which of the following factors caused the Civil War?
(a) Slavery (b) The conflict between the two systems of agriculture (c) A shift in political power resulting from new states entering the Union as free or slave states (d) All of the above