The graph below shows the Chamberlin model. If additional firms enter the market we would expect 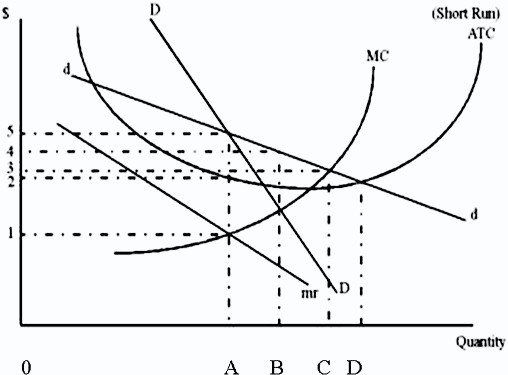
A. the dd curve to become steeper.
B. the MC and ATC curves to shift downward.
C. each individual firm to be worse off.
D. the DD curve to shift right.
Answer: C
You might also like to view...
Under a Cournot duopoly, the collusion curve represents:
A) all possible allocations of the pure monopoly quantity among the two firms in the duopoly. B) all possible allocations of the pure monopoly quantity that would be possible if the two firms in the duopoly did not cooperate. C) all optimal price-quantity outcomes for a cartel rather than a Cournot duopoly. D) the potential profits to be earned by firms in a collusive cartel.
The annuity factor ________ by the amount of the annual payment equals the ________ value of payments for the specified number of years at the specified discount rate.
A) multiplied; future B) divided; present C) divided; future D) multiplied; present
For a monopolist that engages in price discrimination, when the price elasticity in market 1 is less (in absolute value) than in market 2, the optimal price in market 1 will exceed the optimal price in market 2
a. true b. false
The cost effect implies that
A. Higher costs are reflected in higher average prices. B. The aggregate demand curve is downward-sloping. C. The aggregate supply curve is linear. D. Lower average prices result in greater quantity supplied.