The likelihood ratio statistic.
Figure 5.1 illustrates the coverage of the classification rules R1, R2, and R3.
Determine which is the best and worst rule according to:
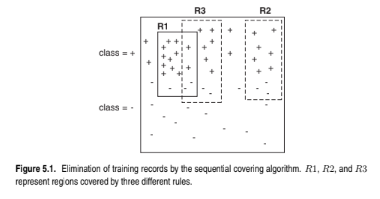
There are 29 positive examples and 21 negative examples in the data
set. R1 covers 12 positive examples and 3 negative examples. The
expected frequency for the positive class is 15 × 29/50 = 8.7 and the
expected frequency for the negative class is 15×21/50 = 6.3. Therefore,
the likelihood ratio for R1 is
![]()
R2 covers 7 positive examples and 3 negative examples. The expected
frequency for the positive class is 10 × 29/50 = 5.8 and the expected
frequency for the negative class is 10 × 21/50 = 4.2. Therefore, the
likelihood ratio for R2 is
![]()
R3 covers 8 positive examples and 4 negative examples. The expected
frequency for the positive class is 12 × 29/50 = 6.96 and the expected
frequency for the negative class is 12 × 21/50 = 5.04. Therefore, the
You might also like to view...
The unspecified namespace is named _________.
Fill in the blank(s) with the appropriate word(s).
When a collision is detected in Ethernet, it is resolved using
a. stop-and-wait ARQ b. go-back-N ARQ c. priority backoff d. random backoff
Self-grounding is one method used to prevent electrical shock to equipment
Indicate whether the statement is true or false
The Web is a worldwide collection of separate, but interconnected, networks accessed daily by billions of people using a variety of devices to obtain information, disseminate information, or communicate with others. _________________________
Answer the following statement true (T) or false (F)