Make a bar graph to represent the data.The following table shows the number of male infants born at Hospital X on New Year's Day (Jan. 1). Create a horizontal bar graph.
What will be an ideal response?
Answers may vary. A possible answer follows.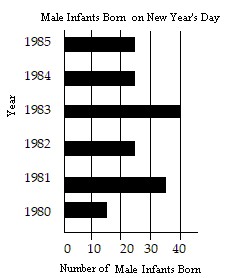
You might also like to view...
Find the average value of the function
?
 ?
over the plane region R.
?
?
over the plane region R.
?
 and R is the triangle with vertices (0, 0), (0, 1) and (1, 1).
?
and R is the triangle with vertices (0, 0), (0, 1) and (1, 1).
?
A. 
B. 
C. 
D. 
E. 
Locate any intercepts of the function.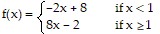
A. (0, -2)
B. (0, 8), (4, 0), ( , 0)
, 0)
C. (0, 8)
D. (0, -2), (4, 0), ( , 0)
, 0)
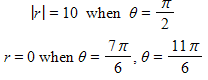
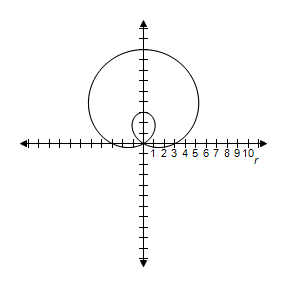
Select the graph of the polar equation using symmetry, zeros, maximum r-values, and any
other additional points.
?
 ?
?
A. Symmetric with respect to 

?
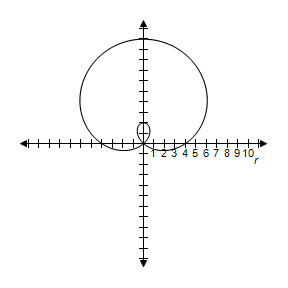
B. Symmetric with respect to


?
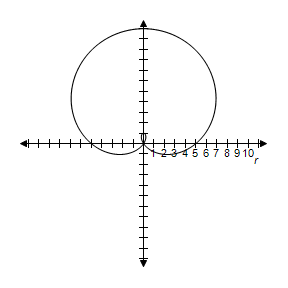
C. Symmetric with respect to


?
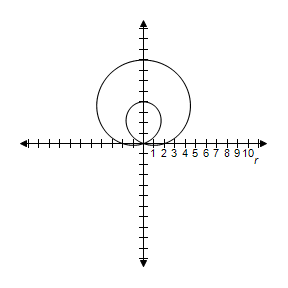
D. Symmetric with respect to


?
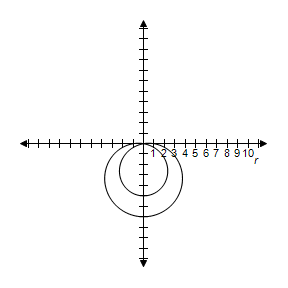
E. Symmetric with respect to

?
Use the Leading Coefficient Test to determine the end behavior of the polynomial function.f(x) = -5x3 - 3x2 + 4x + 3
A. rises to the left and falls to the right B. falls to the left and rises to the right C. rises to the left and rises to the right D. falls to the left and falls to the right