Refer to the accompanying figure.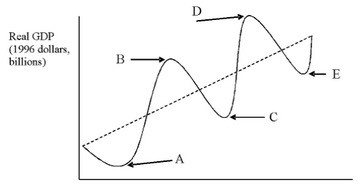 In the figure, which interval represents a business cycle expansion?
A. B to D
B. B to C
C. A to C
D. A to B
Answer: D
You might also like to view...
The new growth theory
A) corrects for poor estimates of population growth. B) applies to only very poor, less-developed nations. C) eliminates technological advances from the growth picture. D) asserts that economic growth can be rapid but can only persist for a limited period of time. E) explains the source of technological advances.
Since 1970, U.S. union membership has
a. increased as a percentage of the labor force. b. declined as a percentage of the labor force. c. remained stable as a percentage of the labor force. d. become more restrictive.
The sum of past federal budget deficits is the:
a. Congressional debt. b. GDP debt. c. national debt. d. trade debt plus GDP.
Refer to the graph shown. If government establishes a price floor of $7.25 per hour, there will be a: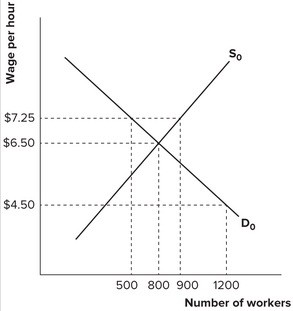
A. shortage of 300 labor hours. B. surplus of 400 labor hours. C. surplus of 300 labor hours. D. shortage of 400 labor hours.