Solve the problem.In a computer simulation, growth in human populations threatens the population of a fictitious species, the striated perch, in North American waters. The bar graph shows the population of the striated perch for several years. The data can be modeled by  where P is the population of that species, in millions, after t years. Use the formula to determine, to the nearest year, in what year there will be no more striated perch.
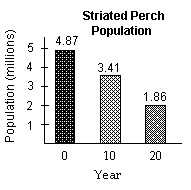
A. year 33
B. year 35
C. year 43
D. year 45
Answer: A
Mathematics
You might also like to view...
Find the vertex of the parabola.y = 2x2 - 4x + 10
A. (1, -12) B. (1, 12) C. (-1, 8) D. (1, 8)
Mathematics
Match the system of inequalities with a graph.5y - x > -37,y + 6x < 39,4x > y,y < 0
A. 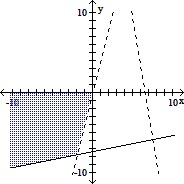
B. 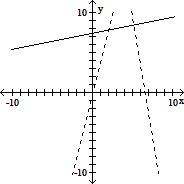
C. 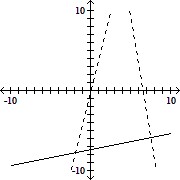
D. 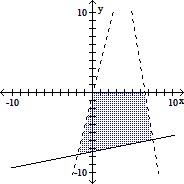
Mathematics
Decide whether or not the equation defines y as a function of x.y = 
A. Yes B. No
Mathematics
Find the volume generated by revolving about the x-axis the regions bounded by f (x) = e2x , x = 0 , and x = 5 .
What will be an ideal response?
Mathematics