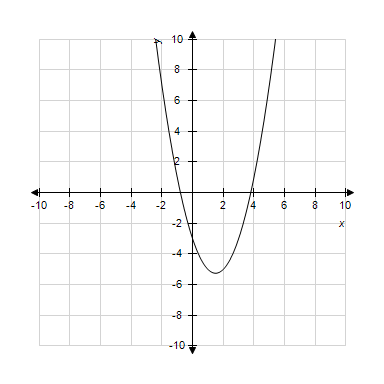
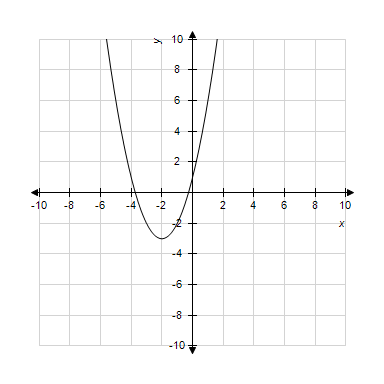
Use a graphing utility with the standard viewing window  and
and  to graph the function. Choose the correct graph below.
?

?
A. ?
 ?
?
B. ?
 ?
?
C. ?
 ?
?
D. ?
 ?
?
E. ?
 ?
?
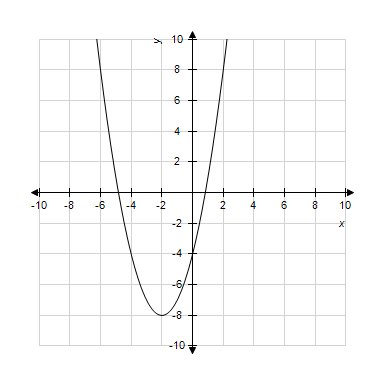
Answer: C
You might also like to view...
The growth rate G, in hundreds per year, of a certain bird species depends on the bird population n, in thousands. The relationship is
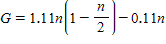 .
A: Make a graph of G versus n. Include populations of up to 1.5 thousand birds.B: What bird population yields a maximum growth rate? Round your answer to two decimal places, if necessary.C: What is the maximum growth rate? Round your answer to two decimal places, if necessary.
.
A: Make a graph of G versus n. Include populations of up to 1.5 thousand birds.B: What bird population yields a maximum growth rate? Round your answer to two decimal places, if necessary.C: What is the maximum growth rate? Round your answer to two decimal places, if necessary.
What will be an ideal response?
Provide an appropriate response.Use the following sets: U = {0, 1, 2, 3, 4, 5}, A = {1, 2, 3}, B = {3, 4, 5} Give the elements in the set A ? B.
A. {3} B. {1, 2, 3, 4, 5} C. {0, 1, 2, 3, 4, 5} D. { }
Use the graph to estimate the solution to f(x) = g(x).f(x) = 3 ln (2x) - 5, g(x) = -2.9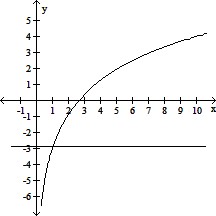
A. x ? 1 B. x ? 3 C. x ? 1.5 D. x ? -2.9
Solve. Round to the nearest tenth when necessary. =
= 
A. 7
B. 
C. 6
D. 