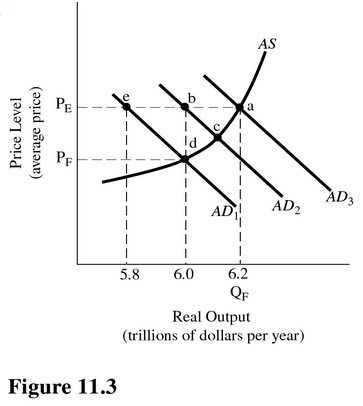
 Refer to Figure 11.3. Assume aggregate demand is represented by AD3 and full-employment output is $5.6 trillion. The equilibrium level of income is
A. $6.0 trillion.
B. $0.8 trillion.
C. $5.6 trillion.
D. $5.2 trillion.
Answer: A
You might also like to view...
The idea that in the market system, consumers ultimately decide which goods and services firms will produce is known as
A) socialism. B) monopolistic competition. C) consumer sovereignty. D) institutional competition.
On the long-run aggregate supply curve
A) an increase in the price level reduces the aggregate quantity of GDP supplied. B) an increase in the price level has no effect on the aggregate quantity of GDP supplied. C) an increase in the price level increases the level of potential GDP. D) an increase in the price level increases the aggregate quantity of GDP supplied.
Refer to the information provided in Figure 4.4 below to answer the question(s) that follow.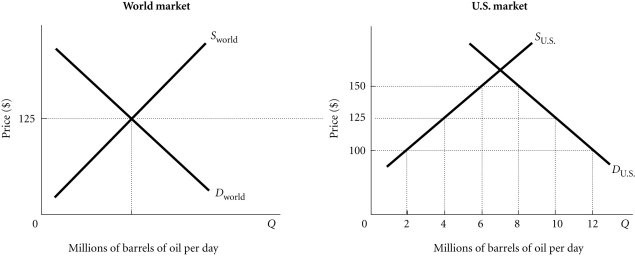 Figure 4.4Refer to Figure 4.4. Assume that initially there is free trade. To reduce U.S. imports without a tariff, the U.S. could
A. allow drilling for oil in the Alaska National Wildlife Refuge. B. increase pollution control regulations. C. increase safety regulations for oil refineries. D. all of the above
In the figure, curves 1, 2, 3, and 4 represent the:
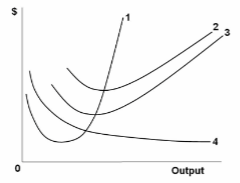
A. ATC, MC, AFC, and AVC curves respectively.
B. MC, AFC, AVC, and ATC curves respectively.
C. MC, ATC, AVC, and AFC curves respectively.
D. ATC, AVC, AFC, and MC curves respectively.