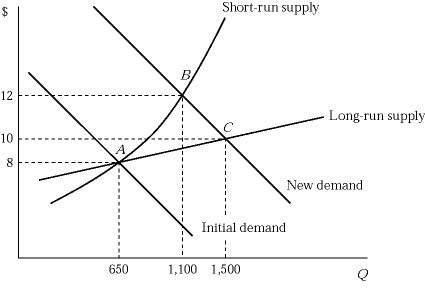
 Figure 6.5 shows the short-run and long-run effects of an increase in demand of an industry. The market is in equilibrium at point A, where 100 identical firms produce 6 units of a product per hour. If the market demand curve shifts to the right, what has happened to an individual firm's output level at point B?
A. Each firm produces two more units per hour.
B. Each firm produces relatively smaller level of output as more firms enter the market.
C. Each firm will produce the same level of output.
D. None of these
Answer: A
You might also like to view...
Explain why "good news for the economy is bad news for bond prices."
What will be an ideal response?
Of the following OECD countries, which has the highest life expectancy at birth?
A) the United Kingdom B) Japan C) Canada D) the United States
Which of the following is most likely to lead to an increase of 1% in the nominal demand for money?
A. An increase in real income of 0.5% B. A decline of 1% in the price level C. An increase of 1% in the price level D. A decrease in real income of 0.5%
Refer to the information provided in Figure 4.6 below to answer the question(s) that follow.Equilibrium in this market occurs at the intersection of curves S and D.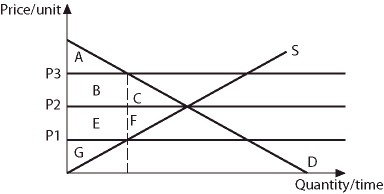 Figure 4.6Refer to Figure 4.6. If price is P1, consumer surplus is area
A. G. B. A + B + E. C. B + C + E + F + G. D. A.