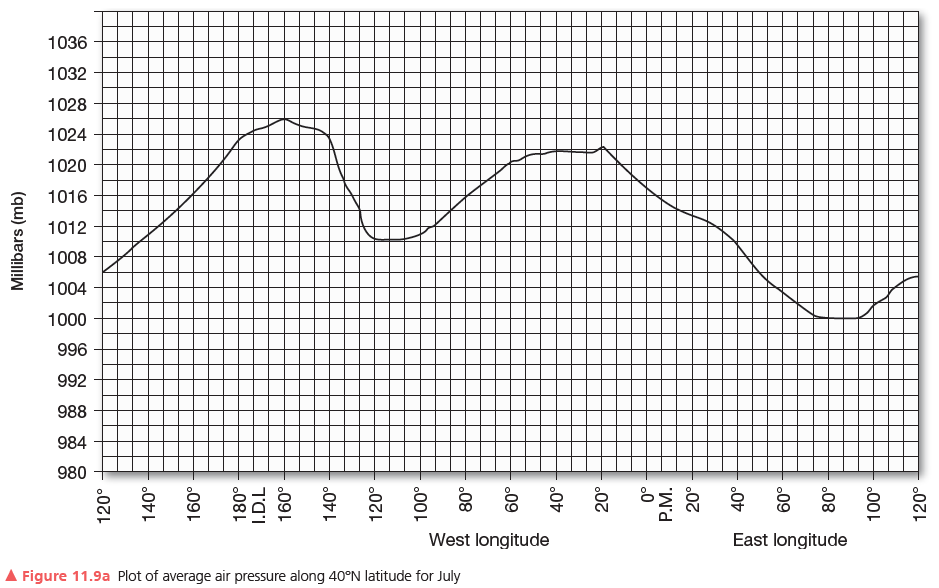
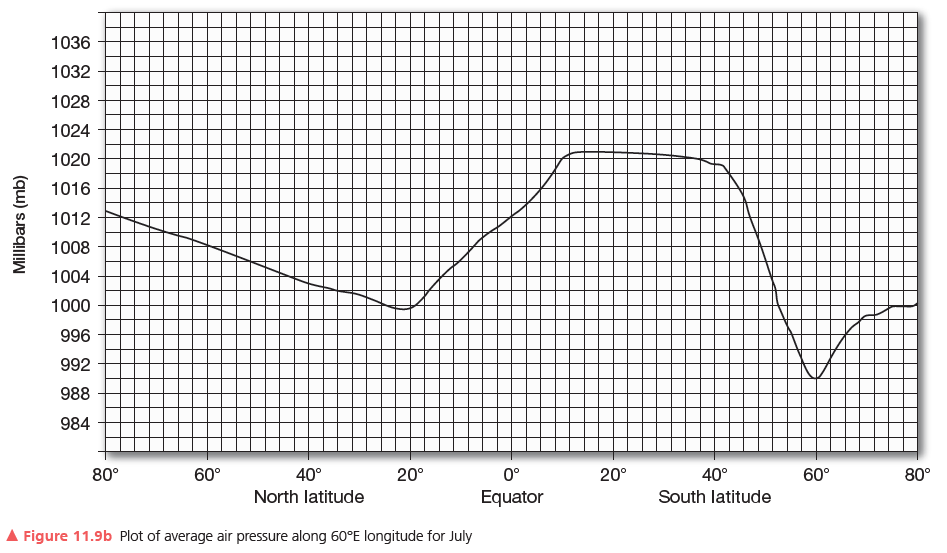
Comparing the two sets of graphs (Figures 9.3 and 9.4 with Figures 11.8 and 11.9), what correlation can be seen between global temperature and pressure patterns? Select a few areas that seem to illustrate a link between your graphs.
Refer to the global air temperature profiles you plotted in Section 2 of Lab Exercise 9 (temperature maps in Figure 9.2a (January) and 9.2b (July), and your graphs in Figures 9.3a and 9.3b and Figures 9.4a and 9.4b). Those temperature profiles in Lab Exercise 9 and these pressure profiles you just completed for this exercise are along the same parallels and meridians.


Where temperatures are high, pressures may be relatively low and where temperatures are low, pressures may be relatively high.
You might also like to view...
Peter tosses an egg against a sagging sheet. The egg doesn't break due to
A. reduced impulse. B. reduced momentum. C. both of these D. neither of these
Of seconds, degrees, and minutes of latitude, minutes are associated with the shortest distances
Indicate whether the statement is true or false.
A joint is a fracture or crack in bedrock along which displacement has taken place.
Answer the following statement true (T) or false (F)
Contour plowing and strip farming are methods designed to
A. Improve plowing efficiency B. Prevent water and soil loss C. Make farms more attractive D. Improve harvesting efficiency E. Prevent weed spreading