How is graph 1 different from graph 2?
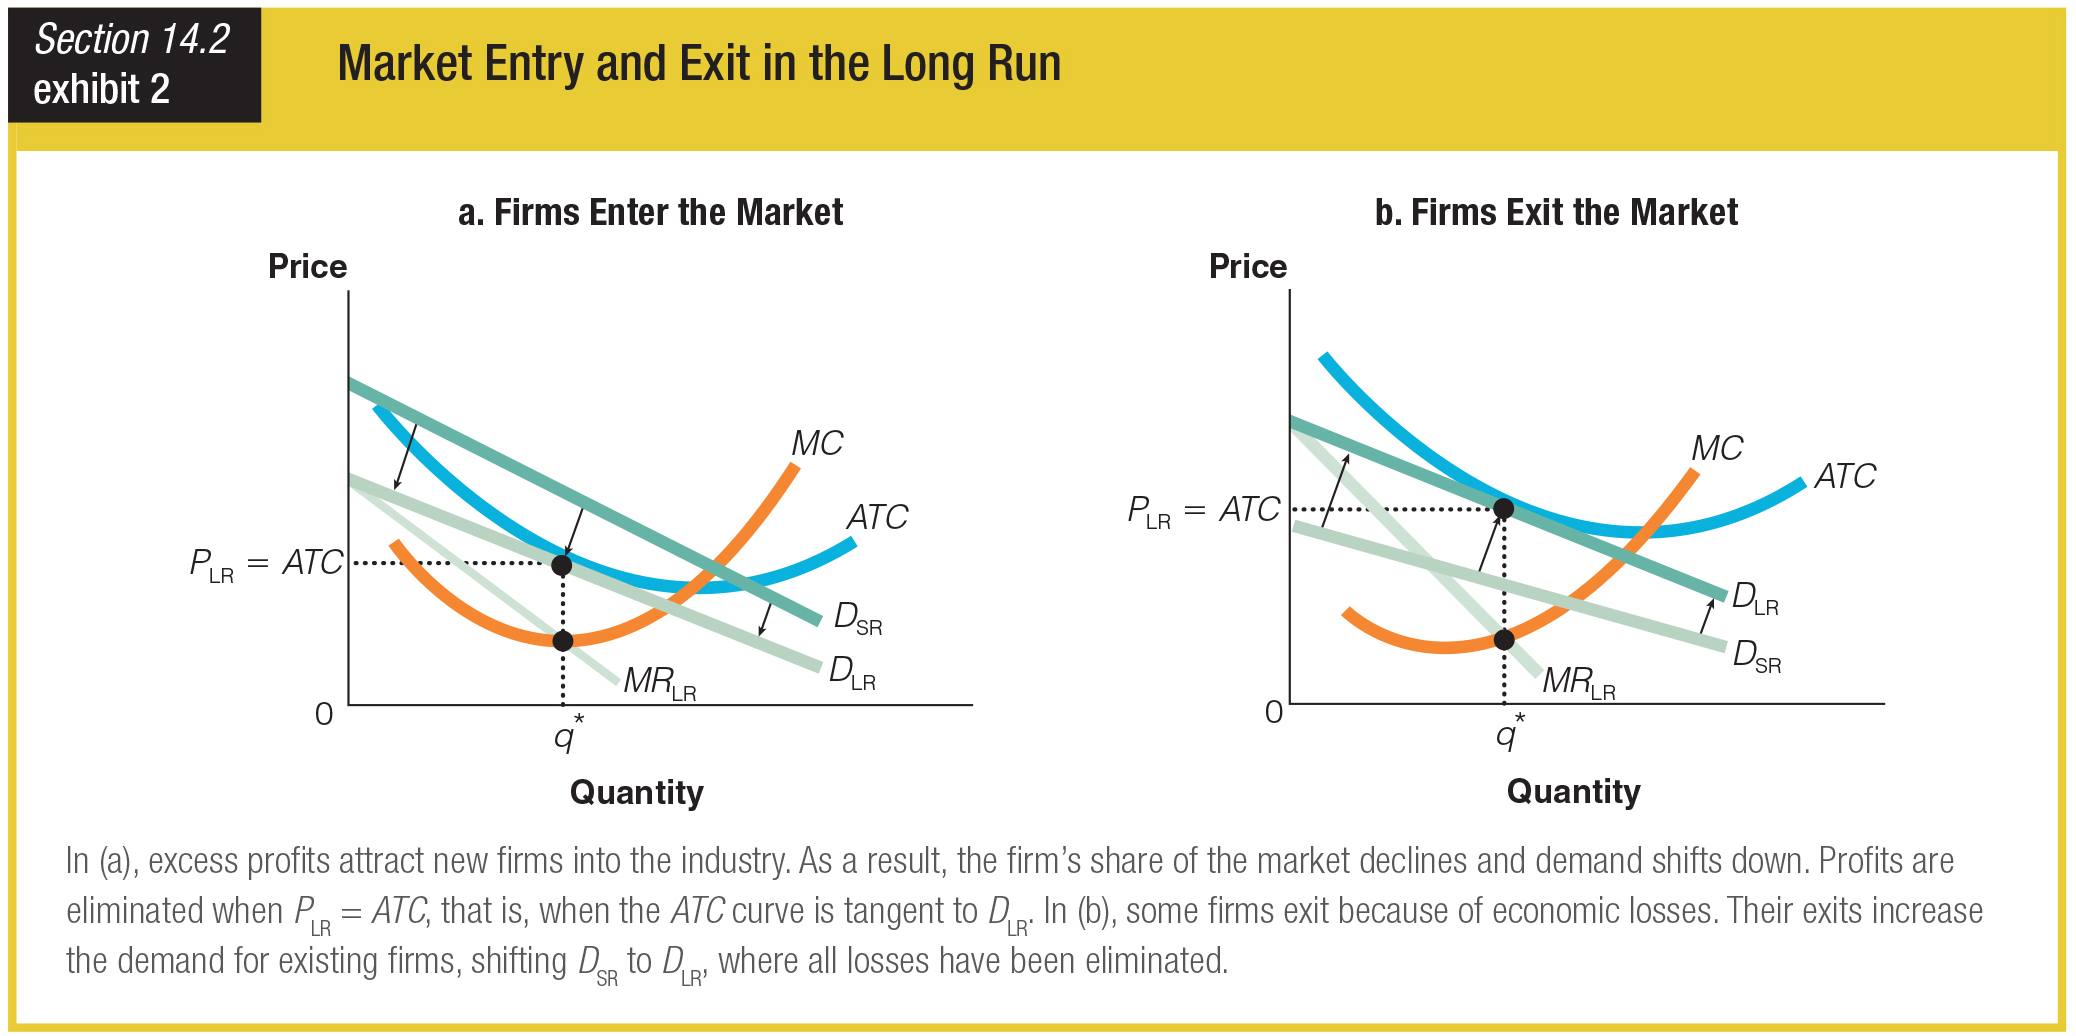
a. In graph 1 the demand curve slants down; in graph 2 the demand curve slants up.
b. The ATC curve is higher in graph 1 than in graph 2.
c. PLR is higher in graph 1 than in graph 2.
d. In graph 1 the demand curve shifts down; in graph 2 the demand curve shifts up.
d. In graph 1 the demand curve shifts down; in graph 2 the demand curve shifts up.
You might also like to view...
A professional hockey franchise is trying to assemble a parcel of land to build an arena. There is one vacant warehouse on the land the franchise needs. In this case,
A) eminent domain will reduce transactions costs and make a pie-increasing arena possible. B) eminent domain will reduce the likelihood of holdouts and make a pie-increasing arena possible. C) eminent domain is not called for as the land can probably be acquired more efficiently through bargaining. D) Both A and B are correct.
How are the fundamental economic decisions determined in Cuba?
A) The United Nations decides because Cuba is a developing economy. B) These decisions are made by the country's elders who have had much experience in answering these questions. C) The government decides because Cuba is a centrally planned economy. D) Individuals, firms, and the government interact in a market to make these economic decisions.
The Pollution Prevention Act of 1990
a. replaced the National Environmental Policy Act of 1969 (NEPA) b. was repealed in 2005 c. ranks source reduction as the primary goal followed by waste treatment d. ranks recycling above source reduction
In the classical range of the aggregate supply curve, greater spending for consumer and investment goods results in:
A. stagflation. B. more unemployment. C. greater output. D. a higher price level.