The investment schedule is downward sloping and the saving schedule is upward sloping with respect to the interest rate. Suppose the equilibrium real investment per year at the market rate of interest is $1 trillion. How is this represented when real national income per year is on the horizontal axis? How is this incorporated into the consumption-function graph?
What will be an ideal response?
Investment spending is a function of the interest rate, but it is autonomous with respect to real Gross Domestic Product (GDP). So the investment function is a horizontal line at $1 trillion when real Gross Domestic Product (GDP) per year is on the horizontal axis. The C + I curve is found by vertically summing the upward sloping consumption curve with the horizontal investment curve. The C + I curve slopes up and is always $1 trillion higher than the C curve.
You might also like to view...
Intellectual property refers to the ________ creations of ________ intelligence.
A) intangible; technical B) tangible; technical C) intangible; human D) tangible; human
According to the graph shown, if the market goes from equilibrium to having its price set at $10 then:
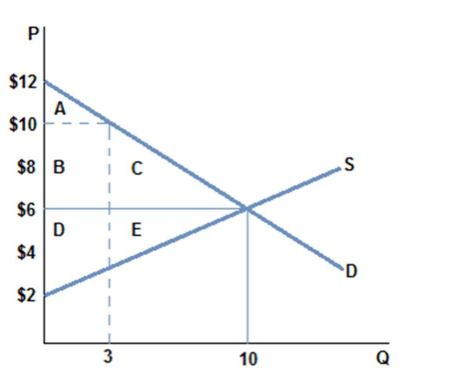
A. producer surplus rises by area B, but falls by area E.
B. producer surplus rises by area B, but falls by area D + E.
C. producer surplus rises by area B + C, but falls by area D + E.
D. producer surplus rises by area B + C, but falls by area E.
Capital, labor, and land are
A. resources. B. factors of production. C. inputs. D. all of the above
All else held constant, as the variance of a payoff increases, the
A) expected value of the payoff increases. B) risk of the payoff increases. C) expected value of the payoff decreases. D) risk of the payoff decreases.