The graph shows the average time spent doing homework. Use the graph to answer the question. 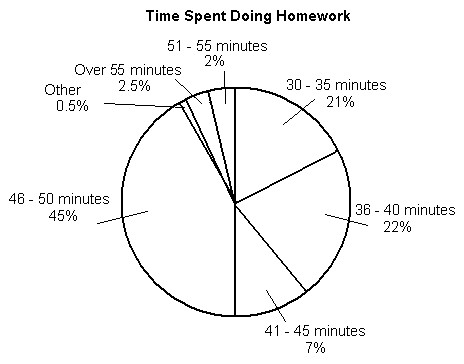 If 1700 students were surveyed, how many students said they spend between 30 and 50 minutes on homework?
A. 765 students
B. 85 students
C. 42.5 students
D. 1615 students
Answer: D
You might also like to view...
Add or subtract, if possible. Assume that all variables represent non-negative values. Simplify your answer. 2 + 3
+ 3
A. 7
B. -11
C. 11
D. 5
?Find the second derivative for the function 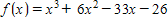 and solve the equation
  .
?
.
?
A. ?-2 B. ?1 C. ?0 D. ?26 E. ?33
Find the points of inflection.f(x) =  x4 - x3 + 11
A. (0, 0) B. (0, 11), (2, 7) C. (0, 0), (2, 7) D. (0, 0), (2, -4)
Use a graphing calculator to find the approximate location of all relative extrema.f(x) = x5 - 15x4 - 3x3 - 172x2 + 135x + 0.058
A. Relative maximum at x = 0.379; relative minima at x = -0.472 and x = 12.565 B. Relative maximum at x= 0.379; relative minimum at x = 12.565 C. Relative maximum at x = 0.34; relative minimum at x = -12.64 D. Relative maximum at x = 0.474; relative minima at x = -0.474and x = -12.593