The circle graph below shows us how an average consumer spends money. Use this information to answer the question. 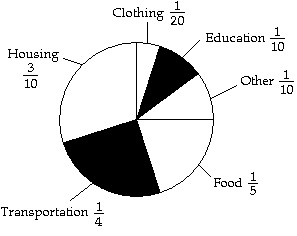 Suppose your family spent $53,000 on the items in the graph above. How much might we expect was spent on food?
A. $10,600.00
B. $9275.00
C. $5300.00
D. $7950.00
Answer: A
Mathematics
You might also like to view...
Solve the problem.How much pure acid should be mixed with 7 gallons of a 50% acid solution in order to get an 80% acid solution?
A. 10.5 gal B. 17.5 gal C. 28 gal D. 3.5 gal
Mathematics
Solve the system.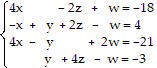
A. x = -5, y = 1, z = -1, w = 0 B. x = 0, y = -5, z = 1, w = 5 C. x = -10, y = 0, z = -2, w = 1 D. x = 5, y = 3, z = -1, w = -1
Mathematics
Solve the equation.4(3x - 5 ) = 256
A. {128}
B. 
C. {3}
D. {-3}
Mathematics
Solve the inequality. Graph the solution on a number line and represent the solution in interval notation when possible.-4(-2 - x) < 6x + 19 - 11 - 2x![]()
A. no solution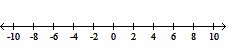
B. all real numbers
(-?, ?)
C. x < 0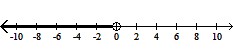
(-?, 0)
D. x > 8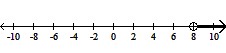
(8, ?)
Mathematics