The pie chart below shows the number of pizzas consumed by college students in a typical month. Use the chart to answer the question.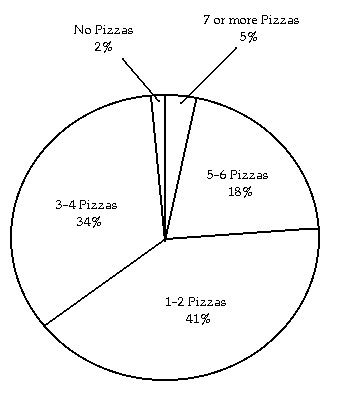 If State University has approximately 47,000 students, about how many would you expect to consume 5-6 pizzas in a typical month?
A. 15,980 students
B. 846 students
C. 8460 students
D. 1598 students
Answer: C
You might also like to view...
Find the probability.A lottery game has balls numbered 0 through 13. If a ball is selected at random, what is the probability of selecting an even numbered ball or a 3?
A. 
B. 
C. 2
D. 7
Solve the formula for the specified variable.I = Prt for t
A. t = 
B. t = P - Ir
C. t = 
D. t = 
Evaluate the sum.
A. 75 B. 36? C. 25? D. 75?
Divide the interval into n subintervals and list the value of ?x and the midpoints  of the subintervals. -1 ? x ? 2; n = 6
A. ?x = 0.5; x1 = -0.5, x2 = 0, x3 = 0.5, x4 = 1, x5 = 1.5, x6 = 2 B. ?x = 0.5; x1 = -0.5, x2 = -0.25, x3 = 0.25, x4 = 0.75, x5 = 1.25, x6 = 2 C. ?x = 0.25; x1 = -0.75, x2 = -0.25, x3 = 0.25, x4 = 0.75, x5 = 1.25, x6 = 1.75 D. ?x = 0.5; x1 = -0.75, x2 = -0.25, x3 = 0.25, x4 = 0.75, x5 = 1.25, x6 = 1.75