The slope of an indifference curve
A. is the rate at which the consumer is willing to exchange one good for another, utility held constant.
B. shows the rate at which the consumer is able to substitute goods in the market.
C. shows the change in utility from an additional unit of the good.
D. is equal to the price ratio at all points.
E. all of the above
Answer: A
You might also like to view...
Use the following graph to answer the next question.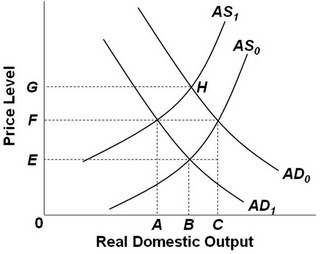 Assume the economy is initially located on AD0 and AS0. An increase in personal income taxes would result in price ________ and real domestic output ________.
A. E; B B. F; C C. F; A D. G; B
If the price of cappuccino on campus falls from $5 to $3 and the quantity demanded increases from 15 to 20, then the price elasticity of demand is approximately
A) 0.47, which mean cappuccino is inelastic. B) 0.57, which means cappuccino is inelastic. C) 1.75, which means cappuccino is elastic. D) 2.25, which means cappuccino is elastic.
The higher the concentration ratio, the
a. more control an individual firm has to set prices. b. more competitive the industry. c. less competitive the industry. d. Both a and c are correct.
Exhibit 6-1 Production of pizza data Workers Pizzas 0 0 1 4 2 10 3 15 4 18 5 19 Exhibit 6-1 shows the change in the short-run production of pizzas as more workers are hired. The table shows the marginal product of the labor input is decreasing with the hiring of the third worker. A possible reason for this diminishing marginal product is:
A. decreases in labor productivity. B. increases in plant size. C. decreases in fixed cost. D. increased division of labor as additional workers are hired.