Refer to the graph shown. With an effective price ceiling at $3, the quantity supplied: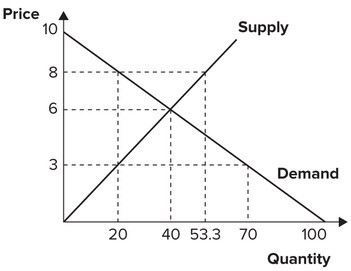
A. falls from 40 to 20.
B. increases from 20 to 40.
C. increases from 40 to 70.
D. falls from 70 to 40.
Answer: A
You might also like to view...
The circular-flow diagram illustrates that:
A) production generates income so that income and production are the same. B) the economy's income is less than its production. C) the economy's income is exceeds its production. D) none of the above are necessarily correct.
A high school student who voluntarily includes a writing sample with their college application is an example of:
A. signaling. B. screening. C. building a reputation. D. statistical discrimination.
If the price of gasoline (a normal good) decreases, other things constant,
a. the demand for gasoline increases b. the demand for gasoline decreases c. the quantity demanded of gasoline increases d. the quantity demanded of gasoline decreases e. neither the demand for gasoline nor the quantity demanded of gasoline changes because everything is assumed constant along a demand curve
Which type of unemployment is most closely connected with the saying "you can't teach an old dog new tricks"?
a. Cyclical. b. Frictional. c. Structural. d. Voluntary. e. Seasonal.