Suppose a tax has been imposed in the graph shown. Which kind of tax is most likely demonstrated by this graph?
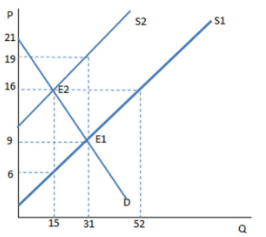
A. A tax on sellers
B. A tax on buyers
C. A tax on big corporations
D. A price ceiling
A. A tax on sellers
You might also like to view...
In an economy, the number of potential workers is 60,000, the size of the labor force is 45,000, and the number of employed workers is 39,000. Calculate the unemployment rate and labor force participation rate in the country
What will be an ideal response?
When a nation starts importing a good or service, domestic employment in that industry
A) decreases. B) stays the same. C) increases. D) might change, but more information about what else the country imports is needed to determine if employment increases, decreases, or does not change. E) might change, but more information about what the country exports is needed to determine if employment increases, decreases, or does not change.
The underground economy refers to
a. all market activity that goes unreported to the government b. all market activity that is not subject to government taxation c. all illegal activity d. transactions between U.S. citizens and foreign nationals e. rent-seeking activities on the part of private citizens
Economic growth implies that:
A.) Prices have risen. B.) Total value of the output produced has increased. C.) Per capita GDP has declined. D.) Resources are limited.