Refer to the above figure. A movement from point A to point B for a good is most likely a result of
A) an increase in the price of that good.
B) a decrease in the price of that good.
C) an expectation of an increase in the relative price of that good.
D) an expectation of a decrease in the relative price of that good.
B
You might also like to view...
Figure 9.1 shows three aggregate demand curves. A movement from point b to point c could be caused by a(n)
A) decrease in government spending. B) decrease in the price level. C) decrease in taxes. D) increase in the money supply.
What three effects can alter the aggregate demand curve?
What will be an ideal response?
Taxes levied on sellers and taxes levied on buyers are equivalent
a. True b. False Indicate whether the statement is true or false
Refer to the following graph.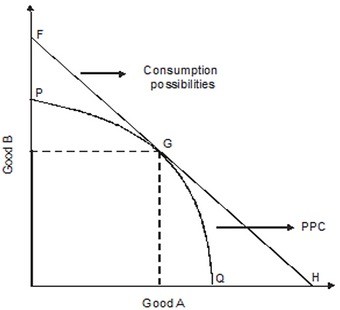 If this country is producing between point G and Q, it will gain by ________ its production of good A and importing more ________.
A. increasing; good B B. decreasing; good B C. increasing; good A D. decreasing; good A