Using Figure 1 above, if the aggregate demand curve shifts from AD1 to AD2 the result in the long run would be: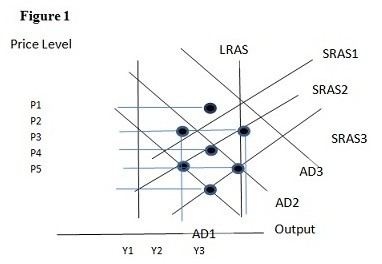
A. P1 and Y2.
B. P2 and Y2.
C. P3 and Y1.
D. P2 and Y3.
Answer: D
You might also like to view...
The graph shown best represents:
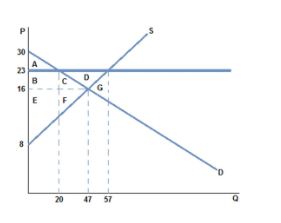
A. a binding price ceiling.
B. a binding price floor.
C. a missing market.
D. a market for an inferior good.
During the period _____, the short-run Phillips curve for the United States was farthest from the origin
a. 1960 to 1964 b. 1964 to 1969 c. 1970 to 1973 d. 1974 to 1983 e. 1984 to 1989
If the Fed shifts to a more restrictive monetary policy in order to help control inflation, the policy shift will generally
a. stimulate aggregate demand and real output as soon as the policy is instituted. b. reduce aggregate demand immediately and quickly bring the inflation under control. c. reduce aggregate demand and help bring the inflation under control, but the primary effects may not be felt for several months (or quarters). d. lower real interest rates in the short run, but in the long run, real interest rates will rise.
Consider the following ratio: the average annual inflation rate/the average annual money growth rate. A country with a ratio less than one would have:
A. to have a high unemployment rate. B. an economy suffering from a recession. C. an average inflation rate less than the average rate of money growth. D. an average inflation rate greater than the average rate of money growth.