Total U.S. government expenditures as a percentage of GDP were largest during which of the following periods of time?
A. The Great Depression
B. World War II
C. The Vietnam War
D. The Energy Crisis of the mid- and late-1970s
Answer: B
You might also like to view...
In the above figure, if the quantity is equal to 1,500,000 units, the deadweight is equal to
A) area A + area B. B) area C. C) area B + area F. D) area G + area H. E) None of the above answers is correct because the deadweight loss is equal to zero.
Different points along a downward-sloping demand curve come from
A. tangencies between indifference curves and budget lines that represent different prices of the good. B. tangencies between indifference curves and budget lines that represent different income levels. C. different points along any one budget line when the prices of the goods are held constant. D. different points along any one indifference curve when the prices of the goods are held constant.
Refer to the information provided in Figure 9.5 below to answer the question that follows. 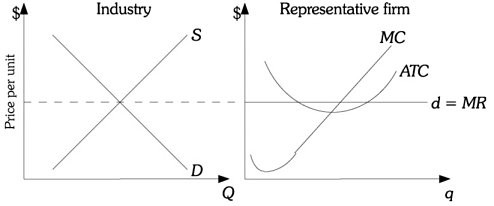 Figure 9.5Refer to Figure 9.5. From the diagram, existing firms in this industry make ________ economic profits, and as long as this continues, ________.
A. positive; new firms will enter the industry and existing firms will not leave it B. negative; new firms will not enter it and existing firms will leave it C. positive; the industry supply curve will shift to the left D. zero; new firms will not enter it and existing firms will not leave it either
Increasing government spending is a contractionary Keynesian economic policy.
Answer the following statement true (T) or false (F)