Refer to the information provided in Figure 2.4 below to answer the question(s) that follow.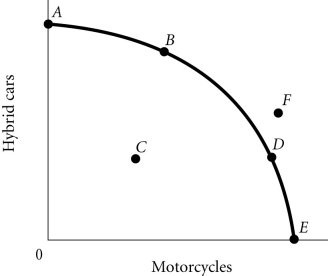 Figure 2.4According to Figure 2.4, Point F
A. is efficient and attainable.
B. cannot be produced with the current state of technology.
C. represents underallocation of resources.
D. represents what the people want.
Answer: B
You might also like to view...
From 1948 to 2010, the United States has experienced only 4 recessions
Indicate whether the statement is true or false
The labor demand curve represents the relationship between the quantity of labor demanded at:
A) different income tax rates. B) different values of average product of labor. C) different wage rates. D) different prices of the good that labor is used to produce.
The commodity substitution bias is most likely to put ________ into the CPI and so ________ the inflation rate
A) a random bias; randomly overstate or understate B) a downward bias; understate C) an upward bias; overstate D) a downward bias; overstate E) an upward bias; understate
What is the difference between a fixed exchange rate system and a managed float exchange rate system?
What will be an ideal response?