The line graph shows the recorded hourly temperatures in degrees Fahrenheit at an airport. 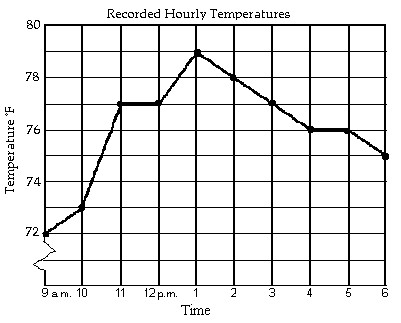 During which two hour period did the temperature increase the most?
A. 10 a.m. to 11 a.m.
B. 9 a.m. to 11 a.m.
C. 12 p.m. to 2 p.m.
D. 10 a.m. to 12 p.m.
Answer: B
Mathematics
You might also like to view...
Find the perimeter of the figure.Rectangle 
A. 40 in. B. 42 in. C. 2 in. D. 21 in.
Mathematics
Provide an appropriate response.Solve the following equation: x2 = 81
Fill in the blank(s) with the appropriate word(s).
Mathematics
Find the exact value of the trigonometric expression without the use of a calculator.tan 
A.  - 2
- 2
B. 2 + 
C. -2 - 
D. 2 - 
Mathematics
Solve the problem.The total number of cars sold at a used car lot for the years 1996 and 1997 was 1064. From 1996 to 1997 the number of cars sold declined by 158. How many cars were sold in 1997?
A. 453 B. 459 C. 463 D. 447
Mathematics