Refer to the above figures. Which panel(s) represent the effect of a decrease in labor productivity?
A) Panel A only
B) Panels A and C only
C) Panel D only
D) Panels B and D only
D
You might also like to view...
If you have a choice of consuming either two apples, three oranges, or one candy bar, the opportunity cost of the candy bar is:
a. two apples. b. three oranges. c. two apples and three oranges. d. two apples or three oranges, whichever you value more. e. the difference in the prices of the three options.
These are the cost and revenue curves associated with a firm.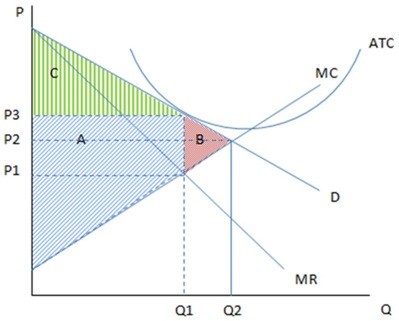 If the firm in the given graph were to produce Q2 and charge P2, then:
A. economic profit would be negative. B. profits would be maximized. C. producer surplus would be zero. D. deadweight loss would be positive.
Firm A and firm B both have total revenues of $200,000 and total costs of $250,000; firm A has total fixed costs of $40,000, while firm B has total fixed costs of $70,000. Which of the following statements are true in the short run?
A. Firm A should operate. B. Firm B should operate. C. Firm A should shut down. D. Firm B should shut down. E. both b and c
Which of the following events would increase the supply of tomatoes?
A. A decrease in the price of pasta products. B. An increase in wages for the tomato pickers. C. A decrease in the cost of fertilizers for the tomato plants. D. Unseasonably hot, dry weather in the tomato-growing regions of the nation.