Figure 9-2
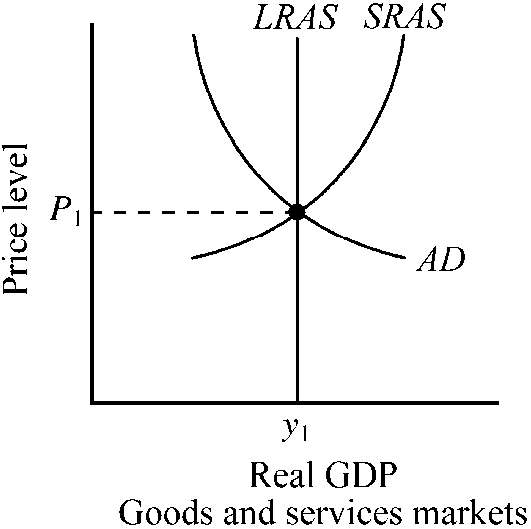
Which of the following is true for the economy depicted in ?
a.
Potential output equals y1.
b.
It would be impossible for this economy to achieve an output greater than y1.
c.
When output y1 is achieved, the actual rate of unemployment will exceed the natural rate of unemployment.
d.
When output y1 is achieved, the actual rate of unemployment will be less than the natural rate of unemployment.
a
You might also like to view...
The following data represent a personal income tax schedule. Answer the next question on the basis of this information.Taxable IncomeTotal Tax$15,000$1,50030,0003,50060,0009,000120,00025,000The average tax rate at the $60,000 level of income is
A. 20.8%. B. 11.6%. C. 10.0%. D. 15.0%.
Which of the following causes an economy to move rightward along the aggregate production function?
A) A decrease in the capital stock B) An improvement in technology C) An increase in the productivity of workers D) An increase in the price level
Explain the dilemma that supply shocks pose when the Fed chooses to use monetary policy to achieve its goals
What will be an ideal response?
The expansion of governmental direct controls over the economy which characterized the "New Frontier" and "Great Society" programs of the Kennedy-Johnson years was continued and expanded by the Nixon Administration
Indicate whether the statement is true or false